This a graph from the new IPCC report that the Coalition tried to sabotage. The below graph depicts a range of impacts to a variety of systems of different global temperature outcomes, from white (undetectable) to yellow (detectable) to red (severe impacts) to purple (severe and irreversible impacts with little adaptability):
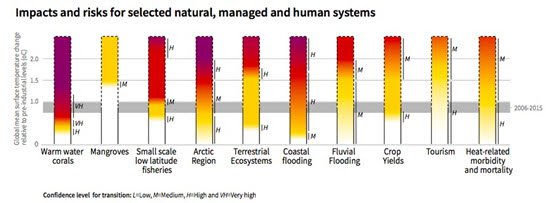
It suggests we should book that trip to the Great Barrier Reef soon.


This post kindly provided to us by one of our many occasional contributors.

Contributions to Pearls and Irritations
Your contribution will fund quality independent comment and analysis in Pearls and Irritations
Contribute